Hot Month, Hot Year, Hot Planet: Absorbing the Latest Climate News
Kendrick Frazier
From: Volume 43, No. 6 November / December 2019
"After this past summer's sizzling heat, many people will undoubtedly welcome the coming of winter in the northern hemisphere. Colder weather, though seasonally temporary, will be refreshing. Australians, though, and others in the southern hemisphere, may not be looking forward to their coming summer…"
*
I don't mean to tease, but I'm not sure it would be politic to fully copy and paste what is, effectively, a pay-walled article. In essence, though, it's merely a review NOAA's State of the Climate: Global Climate Report for July 2019 [1], and the claim of it being the warmest month on record for the globe; a story previously covered by numerous MSM outlets - e.g. the BBC. [2]
To begin with, the article's overview is one of planetary heating now effecting millions, heat records "piling up", and the Arctic melting away - with, apparently, the Greenland ice cap melting at such an alarming rate that "over two days, enough ice melted to cover Denmark with two meters of water". Yep, journalists really do like their florid analogies - "Statista" had it flooding Florida to a depth of 5" [3] and Seth Borenstein, Pennsylvania by about 12". [4]
The article also comments on three new scientific papers which, needless to say, spell doom and gloom. And there's also a section on how science journalists can best get the message across - particularly to stubborn Americans.
"They have found that understanding readers' emotional responses to unwelcome news and drawing on psychologists' findings about human behaviour are as important as the gathering and presenting of the facts".
(Perhaps using the Florida or Pennsylvania analogies, rather than the Denmark one, would be better options for Americans?)
Unfortunately, particularly for a purportedly sceptical blog site, what Mr Frazier fails to comment on is the accuracy of scientific journalism: the "facts" used, the "facts" omitted and the "facts" massaged to support a particular narrative or politics of the individual writer and reader. The "scary" melting of the Greenland icecap is an excellent example of this.
It's estimated to contain some 2,600,000,000,000,000 tonnes of ice and snow, thus daily melts of 12 billion tonnes is not at all unusual. Indeed, such is the present melt rate, if it were to continue it would take 25,000 years for it to disappear, by which time, of course, the next ice age would likely have started – a climate change worthy of the worry. To paraphrase Mark Twain somewhat, the reports of Greenland's imminent icecap "death" is an exaggeration. [5 - 11]
And while in the Arctic, let’s also not forget the dubious goings-on with Iceland's temperature record. [12]
*
Turning our attention to European heatwaves. On the 25th of July the UK 'Independent' ran a story warning of the new normal. [13] However, when one compares this summer in the UK to that of 1976 (unlike St. Greta and the climate strikers, I’ve actually experienced a little climate change) one can see that the 'new normal' isn’t exactly new, and that other than for a handful of days, this year’s UK summer was, at best, distinctly average. [14]
Furthermore, the record temperatures were nothing to do with climate, but the result of an unusual weather pattern drawing hot air up from the Sahara. [15 and 16] Indeed, the UK 'record' set in Cambridge this year, tells us little of climate change, but a lot about the Urban Heat Island Effect. [17]
*
Having now determined the Arctic isn't going to melt away any time soon, [18 and 19] that European heatwaves are not unprecedented (contrary to what dear old Michael 'Hokey Stick' Mann would have one believe) and that the record heat this summer was the result of an unusual weather system driving hot air up from North Africa (and thus not climate-related), was NOAA justified in claiming July 2019 the hottest global month ever? Well, according to Dr Roy Spencer, the answer is an unequivocal no. [20]
Citing concerns over the quality of the data upon which the claim was based (an issue expanded upon by Anthony Watts [21] and Kip Hansen [22]), Dr Spencer says the following:
"One would think that the very best data would be used to make this assessment. After all, it comes from official government sources (such as NOAA, and the World Meteorological Organization [WMO]).
"But current official pronouncements of global temperature records come from a fairly limited and error-prone array of thermometers which were never intended to measure global temperature trends. The global surface thermometer network has three major problems when it comes to getting global-average temperatures:
"(1) The urban heat island (UHI) effect has caused a gradual warming of most land thermometer sites due to encroachment of buildings, parking lots, air conditioning units, vehicles, etc. These effects are localized, not indicative of most of the global land surface (which remains most rural), and not caused by increasing carbon dioxide in the atmosphere. Because UHI warming “looks like” global warming, it is difficult to remove from the data. In fact, NOAA’s efforts to make UHI-contaminated data look like rural data seems to have had the opposite effect. The best strategy would be to simply use only the best (most rural) sited thermometers. This is currently not done.
"(2) Ocean temperatures are notoriously uncertain due to changing temperature measurement technologies (canvas buckets thrown overboard to get a sea surface temperature sample long ago, ship engine water intake temperatures more recently, buoys, satellite measurements only since about 1983, etc.)
"(3) Both land and ocean temperatures are notoriously incomplete geographically. How does one estimate temperatures in a 1 million square mile area where no measurements exist?"
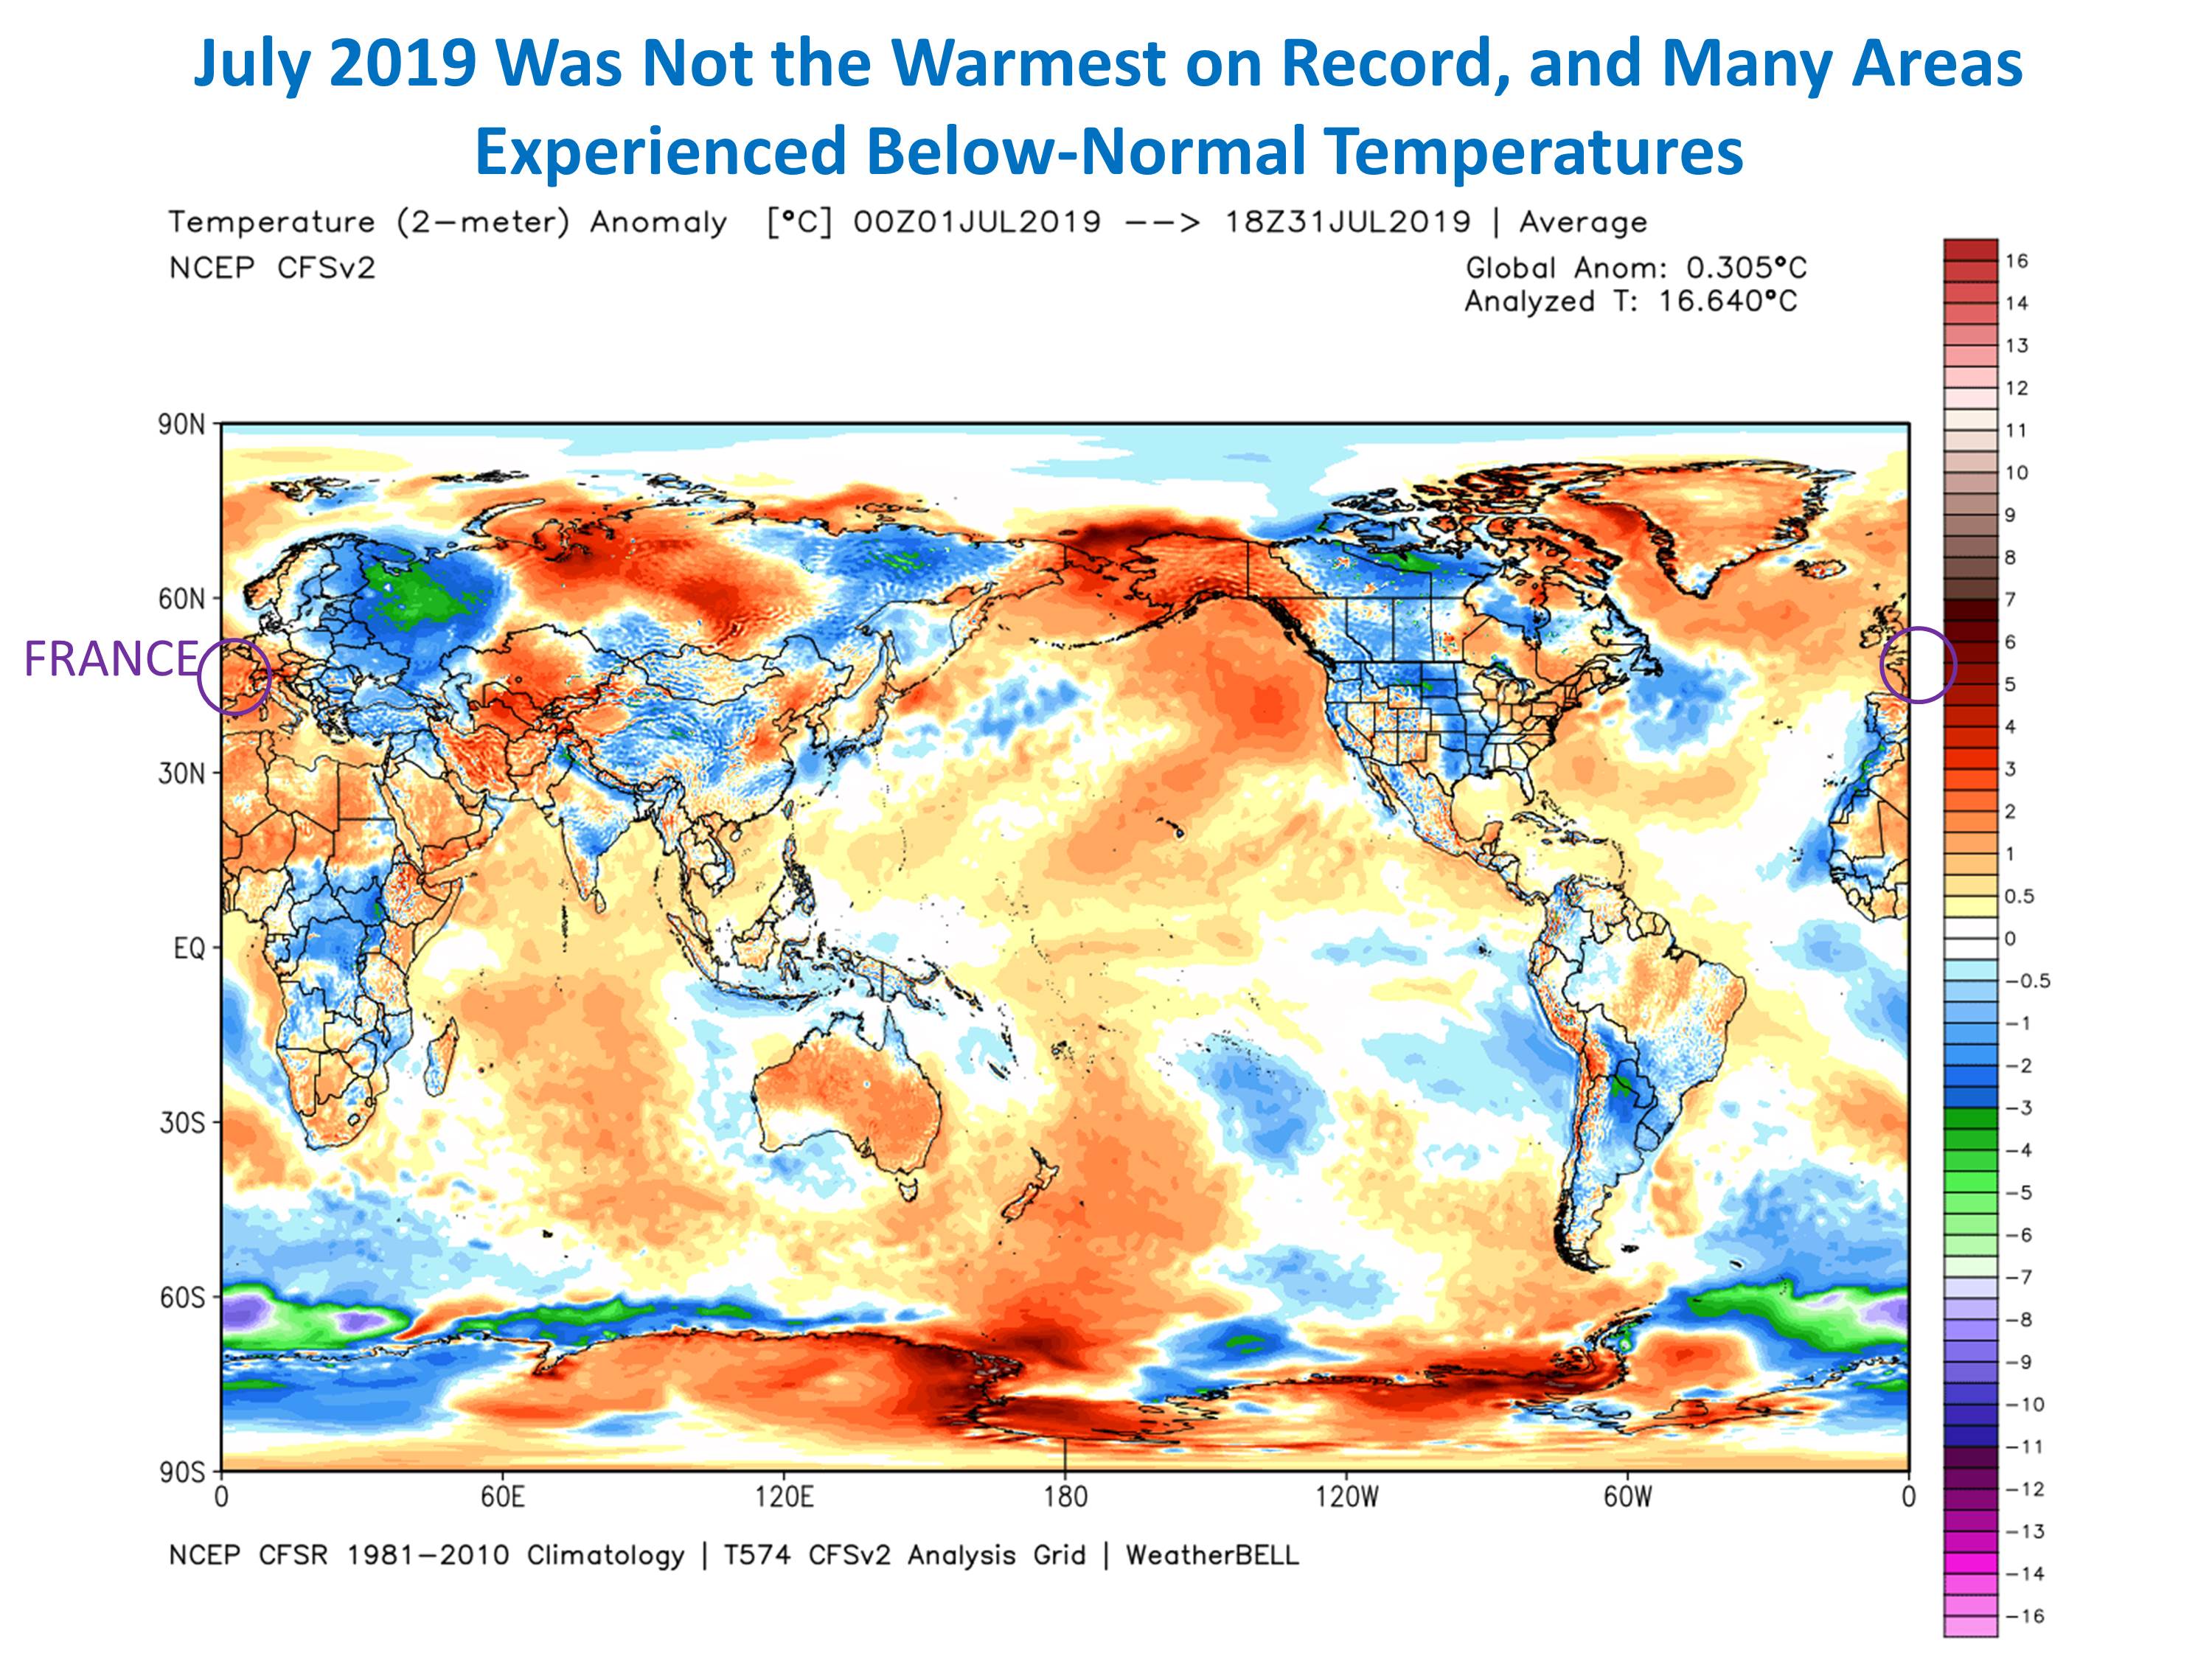
To overcome some of the problems, Dr Spencer advocates the use of data reanalysis, such as that used by WeatherBell.com. Based on NOAA’s own Climate Forecast System Version 2 (CFSv2), WeatherBell’s reanalysis of July this year suggests a global average warmth (against July's 1981-2010 mean) of just over 0.3 deg. C (0.5 deg. F) above normal. This places July this year fourth behind the Julys of 2002, 2016 and 2017. (Note that Dr Spencer's own Our UAH lower tropospheric temperature measurements had July 2019 as the third warmest, behind 1998 and 2016, at +0.38 C above normal. [23])
Visually, the WeatherBell reanalysis looks like this:
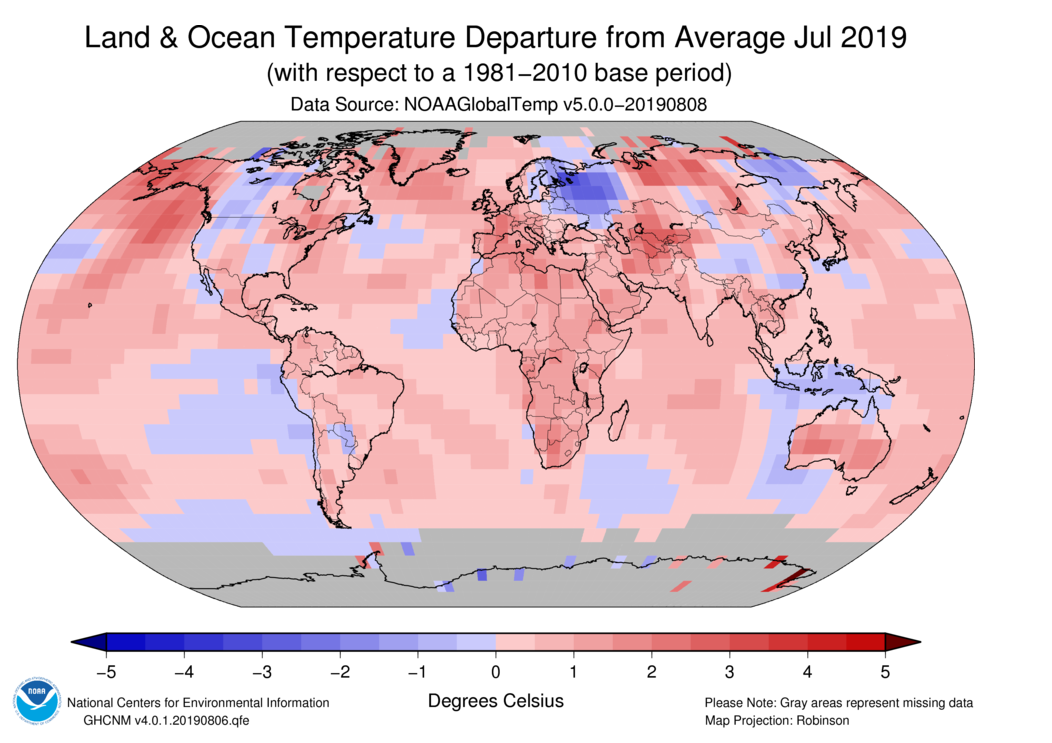
Whereas NOAA's analysis looks like this:
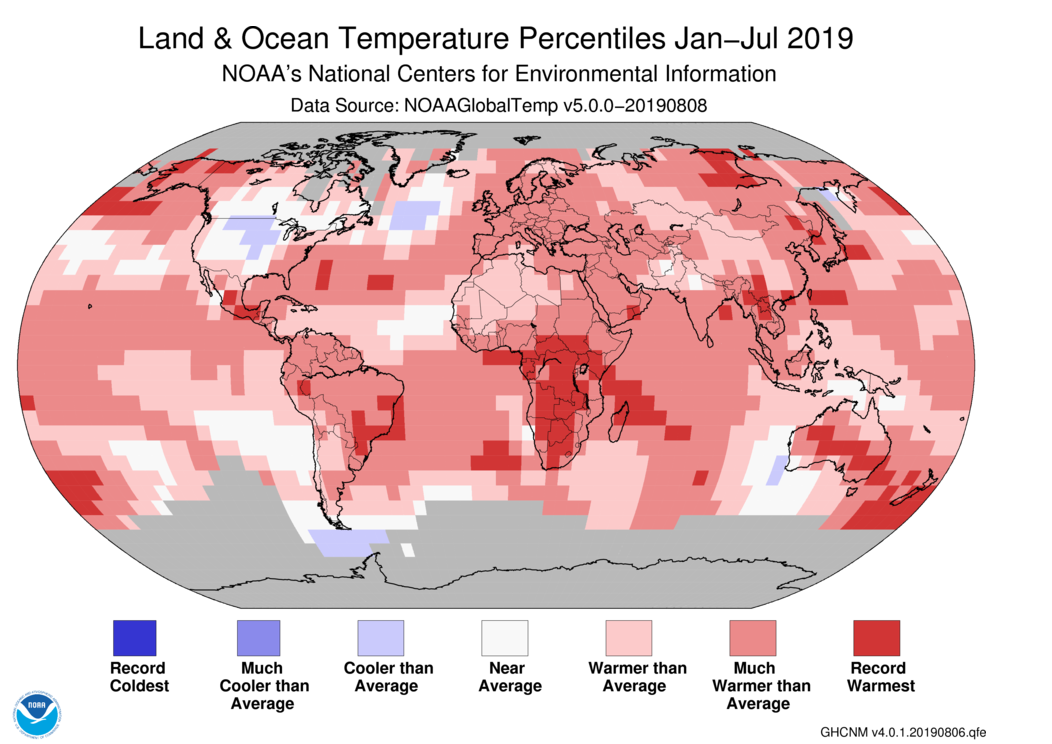
It's interesting to note that while the MSM focussed on the record hot weather in Western European, there was minimal mention of the record cold weather in Eastern Europe. What is also interesting is that the Skeptical Inquirer used the graphic below in its article, rather than the NOAA graphic above.
There's no explanation for this, as it's not referred to in the text. For someone with a sceptical mind, though, this may well lead to a degree of speculation. Surely Mr Frazier didn't merely select it because of its being covered with significantly more red than blue?
Finally, further to the concern raised by Dr Spencer about the lack of surface-based temperature sensors, Tony Heller has his own views on the July claim [24] and also offers an opinion on the practice of temperature homogenisation [25].
*
And so to the three new scientific papers, Mr Frazier mentions:
i). Brönnimann, S. et al. (2019). Last phase of the Little Ice Age forced by volcanic eruptions. Nature Geoscience. ii). Neukom, R. et al. (2019). No evidence for globally coherent warm and cold periods over the preindustrial Common Era. Nature. iii). PAGES 2k Consortium. 2019. Consistent multidecadal variability in global temperature reconstructions and simulations over the Common Era. Nature Geoscience.
Brönnimann et al. (2019) speculate that the Little Ice Age was extended by major volcanic eruptions in the early/mid-19th century.
Speculation about the effects of volcanism on climate is not new – see McGregor et al. (2015) [26] and Bragato and Holzhauser (2019) [27]. The cooling effect of atmospheric aerosols was also the central theme of Rasool and Schneider (1971) [28] – the paper suggesting concern about the possible onset of global cooling. Note that this latter paper also acknowledged the minor role played by CO2 in global warming and its diminishing effect as atmospheric CO2 content increases; i.e. that CO2 has a low climate sensitivity.
With this in mind, the conclusion of Brönnimann et al. (2019) that the early/mid-19th-century volcanic activity kept temperatures cool until anthropogenic warming from the industrial revolution took over, appears a little fanciful. At the time atmospheric CO2 content was too low to be a factor and would, in any case, if Rasool and Schneider is to be believed, be more than countered by the unregulated release of atmospheric aerosols. Sigl et al. 2018 [29 and 30] also shows that alpine glacier melt was not caused by industrial soot and surmise it more likely to be from natural warming caused by the AMO.
Those who do not learn from history are doomed to repeat it, as the old adage goes. And so it would seem with Neukom and PAGES2K.
Hockey Stick Groundhog Day [31]
Paul Matthews
Some ancient history
"Fifteen to twenty years ago, Michael Mann and colleagues wrote a few papers claiming that current warming was unprecedented over the last 600 to 2000 years. Other climate scientists described Mann's work variously as crap, pathetic, sloppy, and crap. These papers caught the interest of Stephen McIntyre, and this led to the creation of his Climate Audit blog and the publication of papers [32] pointing out the flaws in these hockey stick reconstructions. In particular, Mcintyre and his co-author Ross McKitrick showed that the method used by Mann and colleagues shifted the data in such a way that any data sets that showed an upward trend in the 20th century would receive a stronger weighting in the final reconstruction. With this method, generation of a hockey-stick shape in the temperature reconstruction was virtually guaranteed, which M&M demonstrated by feeding in random numbers to the method.
"As climate scientist, Rob Wilson put it in an email:
'The whole Macintyre [sic] issue got me thinking about over-fitting and the potential bias of screening against the target climate parameter… I first generated 1000 random time-series in Excel… The reconstructions clearly show a 'hockey-stick' trend. I guess this is precisely the phenomenon that Macintyre has been going on about.'
"But the climate science community admitted nothing in public. One climate scientist wrote one of the most revealing emails:
'-How should we deal with flaws inside the climate community? I think that 'our' reaction on the errors found in Mike Mann’s work were not especially honest.'
"Ouch.
"This is all ancient history, and the issue is discussed in detail in Andrew Montford's book, The Hockey Stick Illusion.
Two new papers
"So, I felt a strange sense of deja vu or Groundhog Day when I heard from the BBC that 'new' research had found that current warming was unparalleled in 2,000 years. The two papers are written by the PAGES2k team, headed by Raphael Neukom. They are Consistent multidecadal variability in global temperature reconstructions and simulations over the Common Era and No evidence for globally coherent warm and cold periods over the preindustrial Common Era (both paywalled). They use data from a 2017 paper by themselves, A global multiproxy database for temperature reconstructions of the Common Era.
"The PAGES2k data has come in for a lot of criticism at Climate Audit. [33] There are numerous problems, such as inconvenient data being deleted or used upside-down, or the use of 'stripbark' data, against the recommendation of a NAS panel.
"The new papers are quite open about screening for 'temperature-sensitive' proxies. From the 'Consistent' paper:
'For the reconstructions presented in the main text, we use the subset of records selected on the basis of regional temperature screening and to account for false discovery rates (R-FDR subset). This screening reduces the total number of records from 692 to 257, but increases the GMST reconstruction skill for most methods and skill metrics.'
"(GMST is global mean surface temperature). That's a fairly drastic reduction in the number of proxy records. Tucked away in Fig 17 of the Supplementary Information are graphs using the 'full unscreened PAGES 2k proxy matrix', which have a less sticky shape than those in the main paper.
"But as is often the case in climate science, it's worse than we thought. The so-called 'unscreened' PAGES2k proxies were in fact already screened, with a substantial culling of tree-ring data! This is from the 2017 'Global multiproxy' paper:
'…superseded by higher-quality from the same site. Of the 641 records that together compromise the previously published PAGES2K datasets, 177 are now excluded, of which 124 are tree-ring-width series that are inversely related to temperature. To be included in the current database, tree-ring data were required to correlate positively (P<0.05) with local or regional temperature (averaged over the entire year or over the growing season). Trees whose grown increases with temperature…'
"So two rounds of proxy screening have been carried out. Furthermore, in one of the methods they use, the proxies are 'weighted by their non-detrended correlation with the GMST reconstruction target over the calibration period', a further technique that helps to ensure that a hockey-stick will be produced.
"Steve McIntyre is on the case, see this twitter thread. [34] The first tweet refers to this weighting issue, and number 4 in the sequence mentions the 'superscreening' point. The last (at time of writing), number 23, shows how drastic the screening out of North American tree-ring proxies is in the latest papers.
"There is also some decline-hiding going on: in one of the Canadian datasets used, when the time series showed the 'divergence problem' (heading downwards when temperature goes upwards), the divergent parts of the series were just deleted. See this blog post by Shub [35] with the relevant parts of the paper highlighted. Again, if you do this, when you combine all the data to get an overall picture, you will get a stronger hockey stick effect.
The screening fallacy
"The problems with proxy screening were very widely discussed a few years ago at several climate blogs, including Lucia's Blackboard, [36] Jeff's Air Vent, [37] and Climate Audit. But some of you may have forgotten, and some of you may be too new to the game, so here's a refresher. I’ll try to explain it as simply as possible, so that even a BBC environment correspondent could understand it.
"Suppose that you have a number of time series, covering the last 2000 years, coming from annual tree ring measurements or anything else. You think that they might be related to temperature, that is, be a 'proxy' for temperature. Or at least some of them might be. How can you check? Well, you have a reasonable idea of the temperature rise over the last 100 years from thermometer measurements, so you can compare each series against that, to check if it matches. Then you might discard those that don't fit well (screening) or assign a weighting to each one according to how good the match is.
"This sounds at first glance like a good idea. But there's a problem. It's actually a lousy idea. With this method, your data sets could be just random noise, and you'd still get a hockey stick result! A picture is worth a thousand words here. This one was posted [38] by commenter 'Jeez' at Climate Audit in 2012 (in the case discussed there, the paper, Gergis et al., was withdrawn [39] after claims that they had avoided the screening fallacy were shown to be false).
"Suppose that you have six time series, as shown in the first six diagrams. The first four go down-up, up-down, down-down, up-up, and the next two are flat. You carry out your screening test, and you find two of them that match fairly well with the 20th-century temperature record – that's the two with the red circles. Then you average those two, and you get the bottom picture – the hockey stick that you wanted! The two oppositely directed parts at the left-hand end (grey lines) average out to the flat (dotted) line. You can add in the two flat ones as well if you like, they won't make any difference to the picture. In climate-science-speak, your reconstruction is 'robust'!" [See also 40 - 42].
After being thoroughly trashed many years ago, it appears to be a sign of desperation that alarmists still cling to a belief in the integrity of proxy climate reconstructions. It could be argued that Michael (I'm not a statistician) Mann had an excuse in that he didn't know what he was doing [43 and 44] others, though, such as Rosanne "you had to pick cherries if you want to make cherry pie" D'Arrigo, not so.
The ease with which results can be manipulated to produce a desired outcome has become almost legendary. Indeed, such is the nature of stripbark bristlecones to provide spurious correlations; the 2006 NAS panel ruled they should be avoided. They have not. As Steve McIntyre once wryly observed:
"In the past, I charged Mannian paleoclimatologists as being addicted to Graybill stripbark bristlecone chronologies – which I labelled as “heroin for paleoclimatologists” (also describing Briffa’s former Yamal chronology as “cocaine for paleoclimatologists”. Unfortunately, rather than confronting their addiction, Gavin Schmidt and others responded with haughty pearl-clutching indignation, while, behind the scenes, the PAGES consortium doubled down by perpetuating use of these problematic proxies into PAGES 2013 and PAGES 2017." [45]
I've previously commented on the lack of due diligence undertaken by the IPCC when accepting Mann's original work. Whatever happened to Sagan's principle of extraordinary claims requiring extraordinary evidence? One would have thought the whole sorry affair (Climategate included - though it would appear revisionists are, once again, trying to rewrite history in this regard) would have sensitised the IPCC to the dangers they pose; particularly as in the interim further research has strengthened our understanding of both the Medieval Warm Period and the Little Ice Age. [46 and 47] And yet it would seem the IPCC have accepted both of these works for AR6 - even before they were published. If this is not an indication of the IPCC being an inherently political rather than scientific organisation, then I don't know what is.
These papers should be treated with the respect they deserve...
Though purporting to be a serious review of present understanding, any article giving the vacuous Mann airtime (if you’ll forgive the mixing of metaphors) becomes immediately suspect in the minds of real sceptics. Like the Skeptical Science blog, however, it seems the Skeptical Inquirer is anything but sceptical, or at least on the issue of climate change (I’ve not troubled myself with other articles).
In short, the article is little more than a rehash of typical MSM alarmism. Nothing untoward is happening in the Arctic, this year's European heatwave (as to the UK's record temperature) was a weather-related event and little, if anything, to do with climate, July was not the hottest month, and those three scientific papers offer nothing new. I do, however, agree with Heather Goldstone when she said:
"…that if a story evokes certain emotions, it can actually impede a person's ability to absorb the facts, the information.”
Even when confronted with clear evidence of collusion and data tampering, climate alarmists appear incapable of comprehending the scale of the fraud being perpetrated in the name of 'saving the planet'. And they certainly have no understanding of the real cost.
Sometimes doing nothing really is the right thing to do.